Agonists: Comparing Dose-Response Curves
Interpreting Results
You can now have a go at some questions to test whether you can interpret dose-response curve results.
For these questions, you can assume the following:
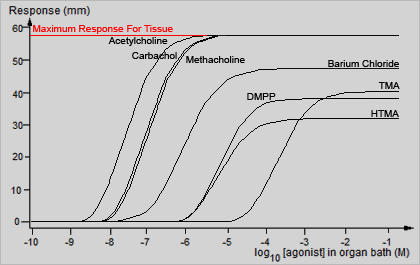
- Changes in the position of dose-response curves along the x-axis are due to variations in affinity
- Changes in the height of dose-response curves up the y-axis are due to variations in efficacy
When ready, click here to see the first question.
Assumptions:
- Changes in the position of dose-response curves along the x-axis are due to variations in affinity
- Changes in the height of dose-response curves up the y-axis are due to variations in efficacy